Ethereum (ETH) is currently trading above the $1,625 price level as of April 15, 2025, showing a notable increase of 4% in just 12 hours. After surpassing the $1,600 and $1,620 resistance levels, ETH reached a peak at $1,690 before experiencing a minor market retreat. Analysts are closely monitoring the price trend to determine whether Ethereum is poised for a breakout or a pullback.
The latest analysis indicates that Ethereum is forming an upward trend line that supports its price at $1,625 on the hourly scale. This support is reinforced by the 100-hour Simple Moving Average (SMA), which aligns with the price level. However, immediate resistance looms near the $1,660 mark, with a more significant hurdle at $1,680. A successful breakout above these resistance levels could open the door for Ethereum to reach $1,690 and potentially extend toward $1,750.
On the contrary, if Ethereum fails to surpass the $1,660 resistance, strong support exists at $1,620 and continues down to $1,610. The 61.8% Fibonacci retracement level from $1,562 to $1,690 is also situated within this range. A break below $1,610 could lead Ethereum toward the $1,575 support level, with further losses possibly driving the price down to $1,550.
Market signals are currently mixed, indicating cautious expectations among traders. The ETH/USD hourly MACD diverges from its bullish zone, while the Relative Strength Index (RSI) remains above level 50, suggesting market neutrality. Traders are looking for confirmation through either a clear breakout of the resistance level or a breakdown of the support zone to gauge the upcoming significant price movement.
In terms of technical analysis, the Ethereum/USDT 5-minute chart on Binance shows critical horizontal levels that could dictate short-term market direction. An intense upward movement reached the $1,670 level, but a strong resistance point led to an aggressive price reversal. This reversal began around 11:30 UTC on April 14, 2025, and was validated by the MACD death cross indicator, indicating bearish momentum.
However, after a sharp drop, the price rebounded as it struck the horizontal support level around $1,613 multiple times. The MACD created a "Golden Cross" at 16:00 UTC, confirming the initial price rally’s validity, suggesting that the recent price boost has lasting strength rather than being a mere temporary bounce. The RSI indicator also exceeded values within the 40-50 range, indicating a rising bullish sentiment in the market.
Despite these positive signs, market participants are cautious, as there is still significant resistance at the $1,648 level. Repeated failures to overcome this area have created hesitation among investors. The analysis suggests that while there is potential for an upward breakout, traders should remain vigilant, monitoring for decisive price movements beyond current resistance barriers.
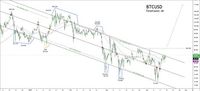
Meanwhile, Bitcoin (BTC) is also experiencing notable price movements. As of April 15, 2025, BTC is navigating within a well-defined descending channel, oscillating between the upper and lower trendlines. The control line in the middle has acted as a key level, with the price reacting several times to this threshold.
Recent activity has seen a few fakeouts above and below the channel, particularly around the 109,356 and 76,600 levels, indicating liquidity grabs in the market. A strong tail formation around 89,164 suggests buyer strength and a potential bullish reversal. Recent rejections at 78,197 and 76,600 highlight a resurgence in demand near support levels.
Currently, BTC sits just under the control line, which could signal an impending breakout. If BTC manages to break above the control line and the 88,789 level, it would indicate a shift towards a more bullish trend, potentially targeting higher price levels. Conversely, failure to break through could see the price retreat towards 80,000, with a drop below 76,600 likely inviting more selling pressure and possibly pushing the price to new lows.
In the altcoin space, Cardano (ADA) is trading at $0.6446, reflecting a slight recovery of 1.08% over the last 24 hours. However, the token is facing significant selling pressure from large holders, with over 100 million ADA sold in the past week. This sell-off has raised concerns about increased volatility and downward pressure on ADA, which is currently trading within a descending channel—a pattern typically associated with bearish momentum.
Despite holding above the $0.63 support level, a breakdown below this point could lead to a sharp decline, potentially targeting the $0.54 zone, which represents a historical support area where buyers might re-enter the market. Additionally, Cardano is forming a rising wedge pattern on the 4-hour chart, which is historically a bearish signal.
As Bitcoin dominance rises, altcoins like Cardano often face downward pressure, as capital tends to rotate into Bitcoin. This dynamic could add resistance to any potential upside moves for ADA. Despite these near-term concerns, the long-term outlook for Cardano remains positive, as the project continues to build on its ecosystem while broader market sentiment leans bullish.
In summary, Ethereum's price movements are under close scrutiny as it approaches key resistance levels, while Bitcoin navigates its descending channel, and Cardano grapples with whale selling and bearish technical patterns. Market participants are advised to remain vigilant, as the next few days could determine the trajectory of these cryptocurrencies.